Fall 2022 Data Visualization Award Winner - Ten Strands / CAELI Data Project
Student researchers: Arjun Banerjee, Dylan Nguyen, Luke Chang, Ricardo Yin
The Data Visualization Award recognizes the team with the best data visualizations. Data visualization is a key method to convey information for non-experts, gather more attention, and create a larger impact. A great visualization is worth a thousand words. As Cleveland and McGill (1984) note, "The power of a graph is its ability to enable one to take in the quantitative information, organize it, and see patterns and structure not readily revealed by other means of studying the data."
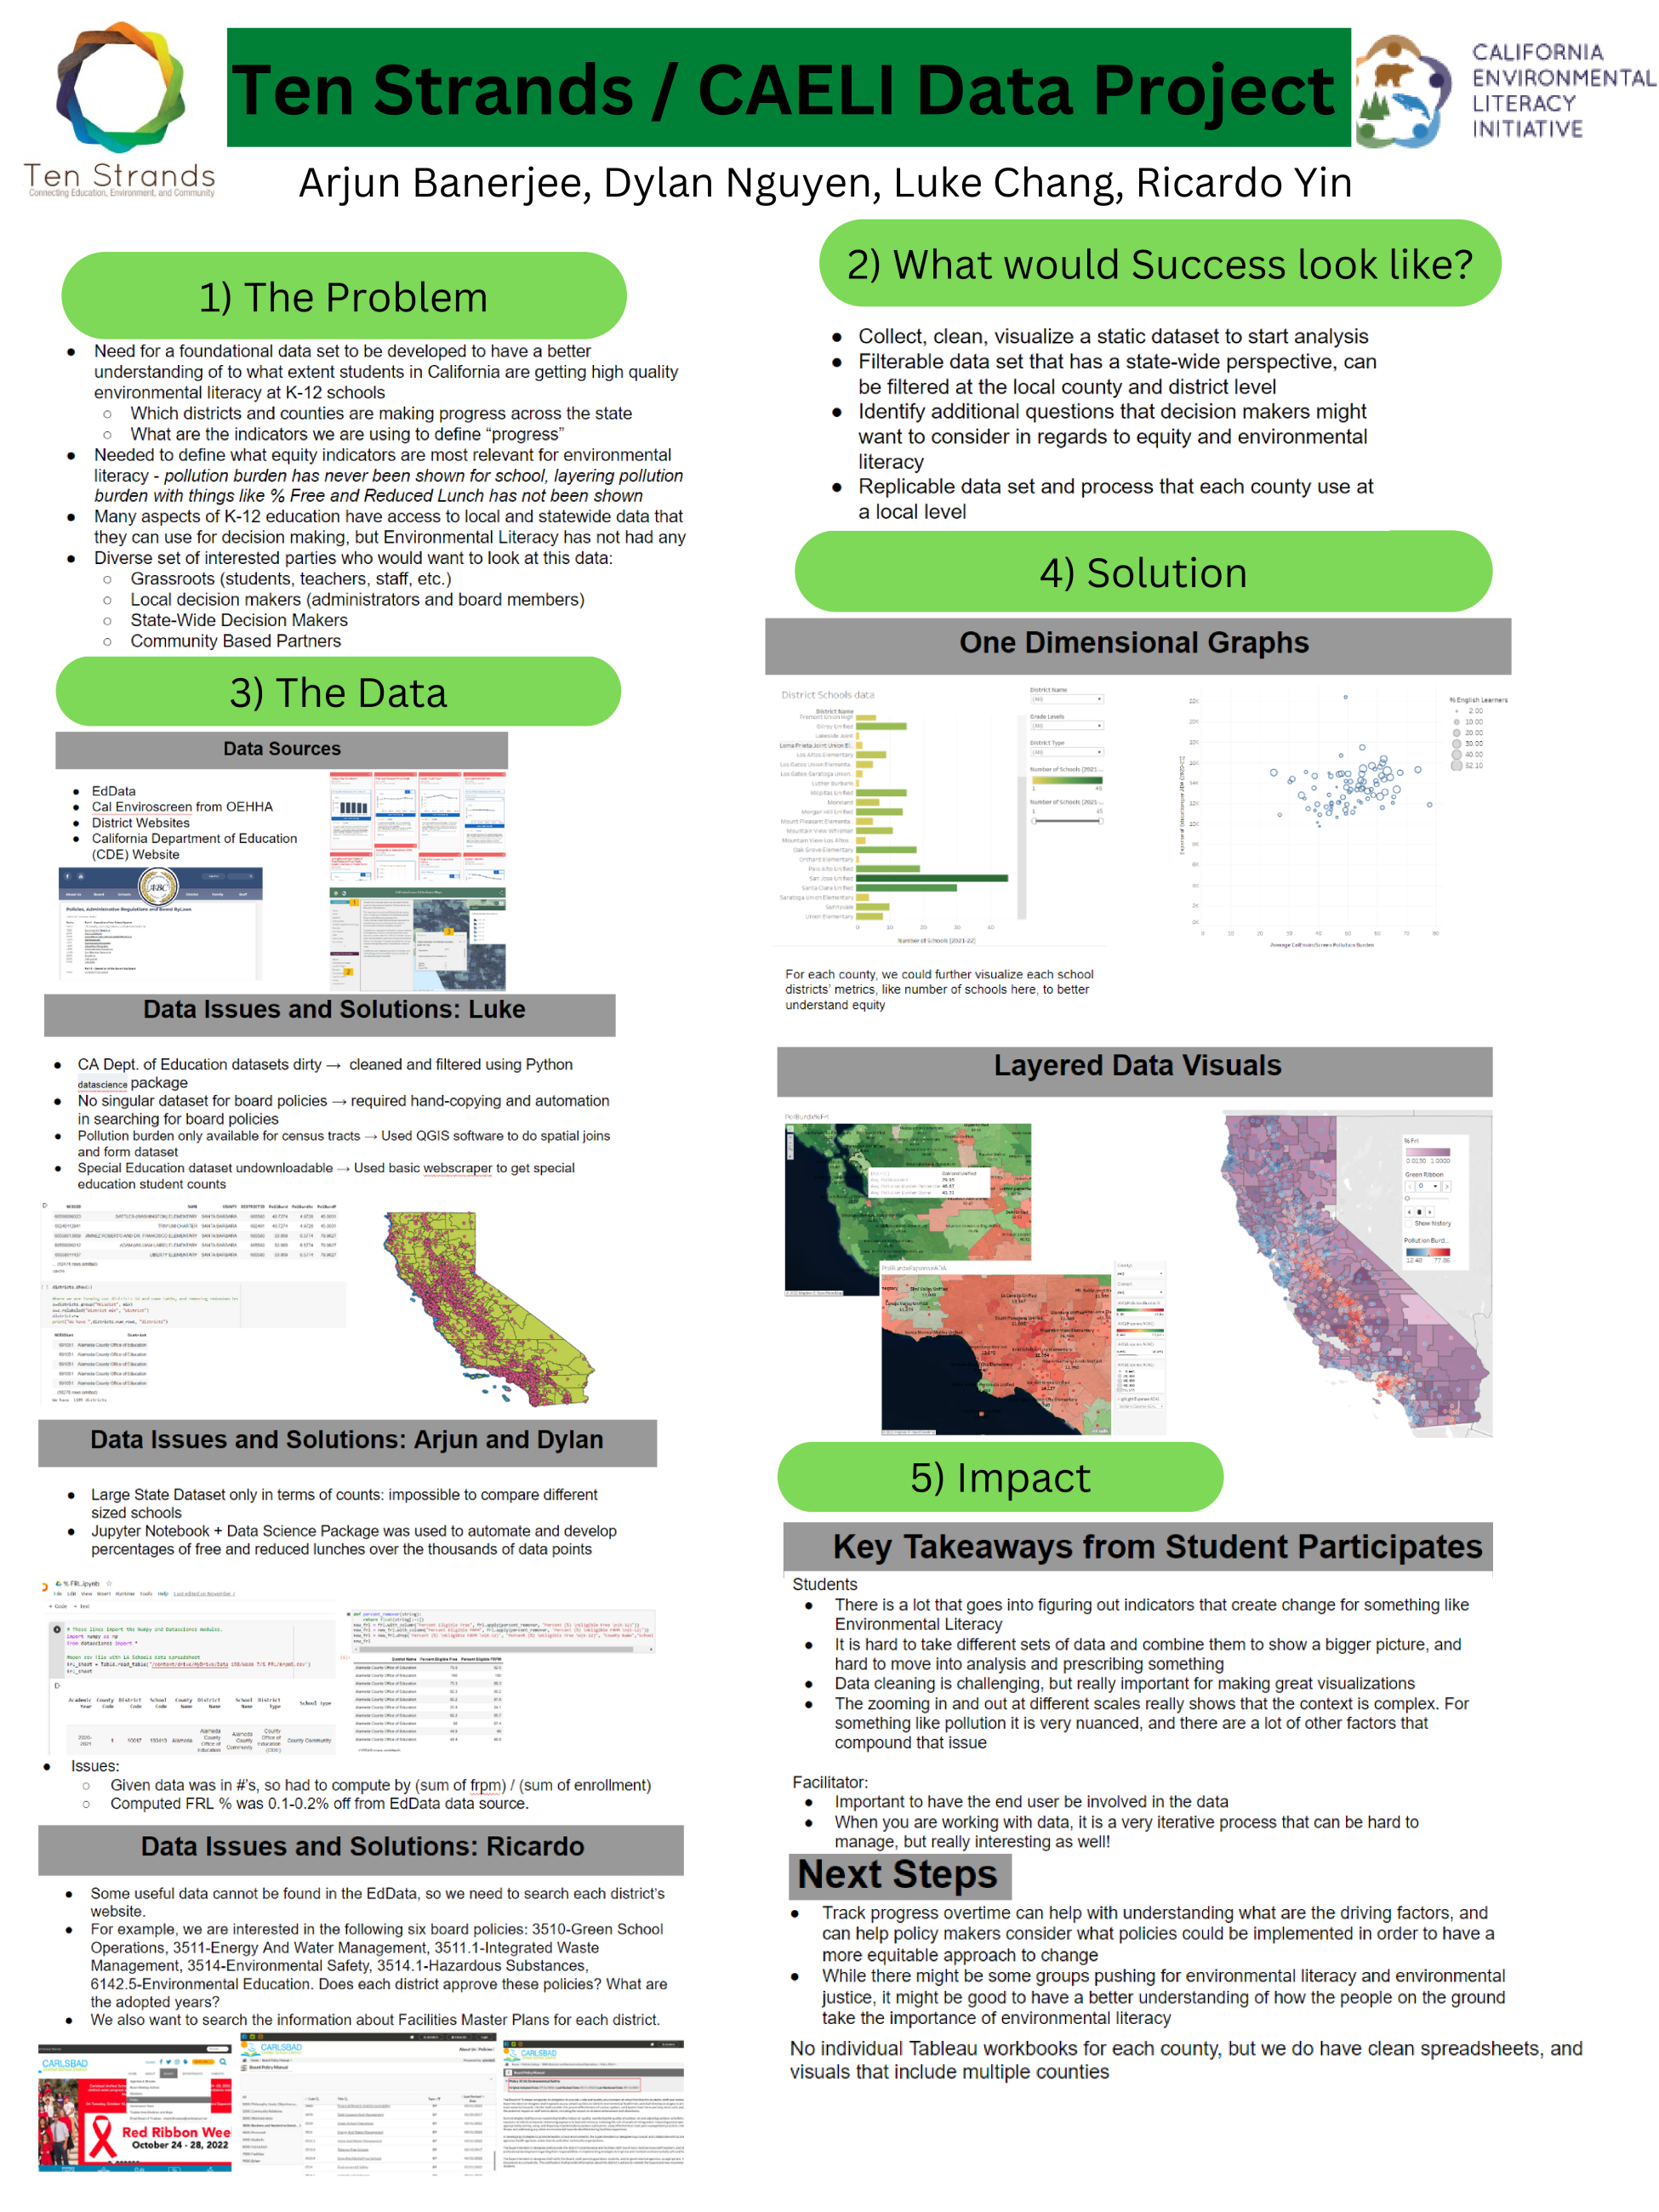
The Ten Strands / CAELI Data Project, in partner with Ten Strands and the California Environmental Literacy Initiative, set out to better understand the extent of high quality environmental literacy education at Californian K-12 schools. Their goal was to collect, clean, and visualize a filterable data set to begin analysis, and to identify additional questions that would be considered in regards to environmental literacy and equity.
The student researchers' goal was to make a replicable dataset and process that each county in California can use at a local level to better understand environmental literacy and equity in education.
The data visualizations in this project were unique and clear as the team utilized maps with multiple layers, showing the issues and potential solutions in a geographic visualization. Their extensive usage of high quality visualizations made the team qualified for the data visualization award.